Flood-impact map a Canadian first
November 16, 2022
By Western University News
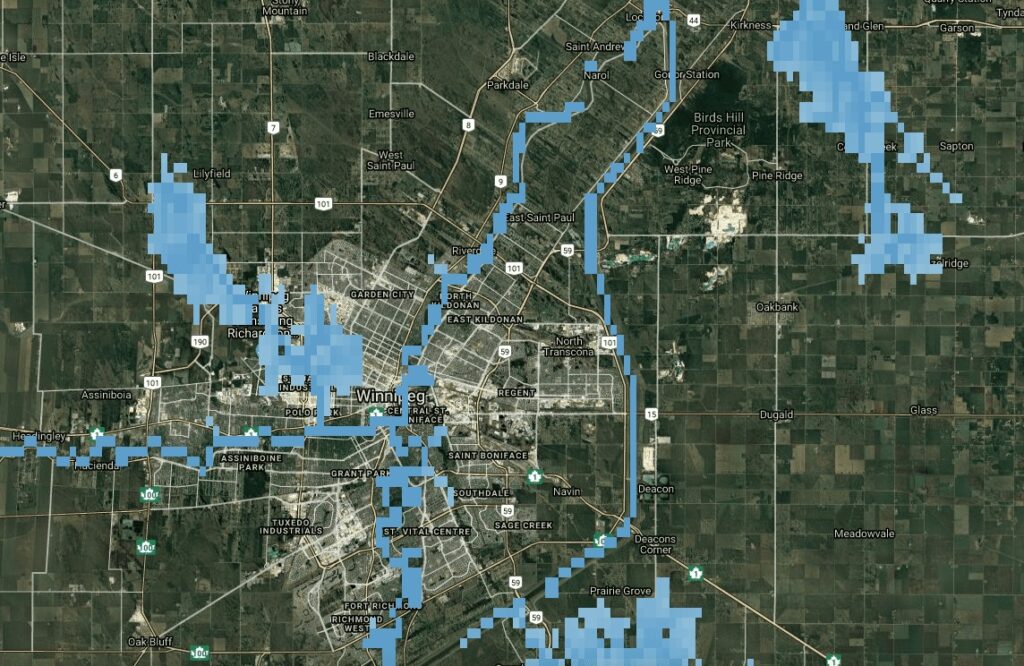 Flood depths forecast for 2100 at Winnipeg could more than double, at 4.4 metres higher than regular flow. Source: floodmapviewer.com
 A Western University flood-control expert has developed the first Canada-wide maps showing how floodplains – including low-lying areas of major cities like Vancouver and Montreal – may become inundated in the next 80 years under various climate change scenarios.
About four million Canadians now live in flood-affected areas – and they and others will be at increased risk in coming decades, the mapping data shows.
Engineering professor Slobodan Simonovic’s mapping tool is a deep dive into one consequence of more frequent, and more intense, extreme weather induced by climate change.
“What we used to call 100-year floods in London, for example, are taking place now once every 30 years,” he said. “Floods are killing people around the world, and in countries you wouldn’t expect, such as Germany, the U.S. and Japan. A year’s worth of rainfall recently fell, in just three days, in central China.
“And here in Canada, until now, we haven’t had a nation-wide, standardized way of understanding the vulnerabilities of our own landscapes.”

Slobodan Simonovic
Simonovic said releasing the map tool is part of his personal commitment, and Western’s newest contribution, to mitigating and adapting to the impact of climate change. At the same time, world leaders gather for COP26 climate meetings in Glasgow this week and next.
The maps are a visual distillation of almost 150,000 reference documents – including current and historical rainfall and snow-melt run-off data, topographic analyses, hydrodynamic modelling, urbanization and deforestation factors that impede effective drainage, plus a range of climate projections.
Using this data, Simonovic has superimposed on web-based maps current and future flood frequency, flood depths, flood inundation and flow velocity.
Users can search by postal code and zero in on neighbourhoods, or explore specific watersheds to compare current 100-year flood zones to those forecast under worst-, mid- or best-case climate-change scenarios 60 years and 80 years from now.
“The message is very clear: Up to 30 per cent more of Canada may be under water by 2100. And flood depth may increase by up to 60 per cent,” Simonovic said.
In short, the unusual – heavy deluges and unseasonal thaws that overwhelm streets, homes, sewers and dams – will occur not once in a century but regularly, several times in a generation.
The maps identify the most vulnerable areas in one-square-kilometre grid segments: places where rivers are most likely to overflow their banks, and by how much.
They include:
- The Assiniboine and Red rivers that converge on Winnipeg, Man. (where some of the country’s most advanced flood-management systems protect the city by redirecting heavy flows to surrounding areas). At one location, 100-year flood levels rise from historical/current 1.93 to 4.4 metres under the climate scenario with maximum level of emissions – placing a severe strain on Winnipeg’s flood-management structures and inundating surrounding areas.
- The Fraser River that runs through Vancouver, B.C. At one location in that city, historical 100-year floodwaters rise to a depth of 2.07 metres (above normal, non-flood seasons). Under a scenario where climate change continues at the current rate of carbon emissions, floodwaters rise to a depth of 3.19 metres
- The Thames River in London, Ont., where a 100-year flood (based on current and historical data) now raises the water level at the forks of the Thames by 6.2 metres. From 2060-2100, the new normal 100-year flood depth becomes 7.6 metres.
Also vulnerable are streams in Northern Ontario and Northern Quebec, the Mackenzie and Lower Mackenzie Rivers of Northwest Territories and northern British Columbia; and much of the island of Montreal.
The consequences go beyond an increased risk of flooded basements and insurance claims, although that too is a significant consequence and cost, he said.
Such flooding directly jeopardizes human lives, he said. It can crumble bridges, wash away roads, overwhelm drinking-water and wastewater treatment facilities, and disrupt ecosystems for generations to come.
Understanding the location and extent of the risk can help insurers, engineers, homebuilders, conservation authorities, and municipal, provincial and federal governments plan better policies and stronger flood protection, he said.
It’s one reason the Canadian government has committed $63 million over the next three years, through Natural Resources Canada and Environment and Climate Change Canada, to more detailed flood maps for high-risk areas.
An August report from the United Nations International Panel on Climate Change for the first time emphasized a much stronger connection between climate change and extreme weather than ever before, Simonovic noted.
His mapping work was funded through a collaborative grant from the Natural Sciences and Engineering Research Council of Canada (NSERC) and Chaucer Syndicate, a group representing insurers of insurance companies across Canada.
Simonovic is recognized as one of the world’s most influential climate change scientists, based in part on his high volume of published research, citations by other researchers and policy influence.
Simonovic has received awards for excellence in teaching, research and outreach. He has published more than 600professional papers and three textbooks, was named a Fellow of the Royal Society of Canada in 2020 and was inducted into the Canadian Academy of Engineering in 2013.
Simonovic said the next steps in this project are to expand the mapping to include coastal flooding; fine-tune projections to even smaller grids with greater neighbourhood detail; and explore with Natural Resources Canada the possibility of hosting the results under Atlas of Canada data holdings.
This article was originally published by Western University. Republished with permission.
Print this page